Monitoring ESXi Syslogs with OpsMgr 2007 R2 (Part 1)
February 7, 2011 by windowsmasher
NOTE: Part 2 – Basic Reports was just published.
NOTE: This is a BETA POST! This post will be updated throughout the next few days to correct spelling mistakes and provide a lot more information about what’s going on in a learn-by-example sort of way. However, I can’t seem to resist the urge of publishing what I already have. Please let me know if you have any problems, and I’ll address them right away! This stuff is _hard_ at first!
There’s a few posts around the net on Syslog monitoring in Operations Manager 2007 ( SCOM ). These posts helped me understand the process (and OpsMgr) a lot better, but didn’t really go as far as I’d like. I needed to capture, process, and export syslog data from my ESXi hosts. Turns out this is extremely difficult to poke around and figure out, but easy to set up if you have a guide.
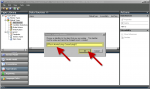
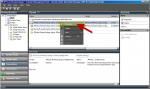
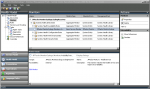
Some people are okay with the built-in syslog event collectors in OpsMgr, but they give you output like this. Notice how the OpsMgr’s event properties don’t really give you anything useful (Level: Success, Name: Win-Syslog, etc.)
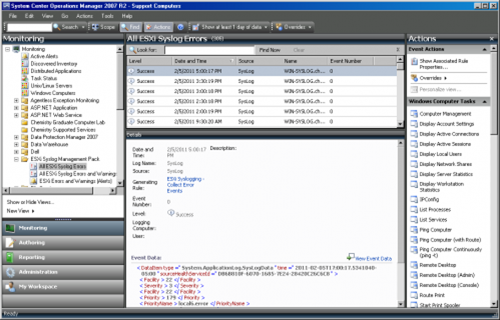
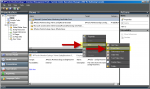
I wanted more, and figured out how to make my events look like this:

Short-cut!
Getting this to work is a long process. If you want results without the learning curve, follow these steps. Otherwise, enter at your own risk!
- Complete steps 1-4 under “Preparation” below.
- Download and import my custom management pack (right-click, save-as): JPPacks.MonitoringSyslogs 1.0.0.9.
- Run these two PowerShell commands on the new VM that will be collecting syslogs:
New-Item -Path HKLM:\SOFTWARE\JPPacks
New-ItemProperty -Path HKLM:\SOFTWARE\JPPacks -Name SyslogEnabled -PropertyType DWord -Value 1
- “Configure ESXi” according to the screenshots below.
- Create an override for the new discovery “JPPacks – Discover Syslog Receivers” changing ‘frequency’ to “20″ (seconds).
- You should see your VM show up under “Syslog Receiver States” within a minute or so.
- Delete that frequency override you made in step 5, or you’ll load down your OpsMgr server.
- Send a few test events from Kiwi Syslog Generator. By default only events severity 4 and under (Warning, Error, and Emergency) are logged, this can be changed in the collection rule (see below).
The rest of this post outlines how to create the custom management pack which allows you to parse the raw syslog data into nice, informative events. This includes DNS lookups and mapping <Severity> to <EventLevel> for the pretty Success\Warning\Error icons. Once you have the raw event data in PowerShell and all the modules working together, you can really do anything you want–create new properties, process syslogs differently depending on the source host\IP, etc.
Table of Contents
Preparation
First, prepare your environment:
- Deploy a new VM called Win-Syslogs. This system will receive the ESXi syslogs to take the load off of your OpsMgr RMS server.
- Install the OpsMgr agent on Win-Syslogs.
- Open port 514 in the firewall on Win-Syslogs to your ESXi hosts and your local workstation (for testing).
- Download and install Kiwi Syslog Generator on your local workstation (for testing).
- Download and install System Center Operations Manager 2007 R2 Authoring Resource Kit on your local workstation.
- Download and install XML Notepad 2007 on your local workstation.
- Download my Powershell event parsing script from my Chemistry website, and save it as Process-Syslogs-Rev1.ps1.
Configure ESXi
The next step is enabling ESXi Syslogging.
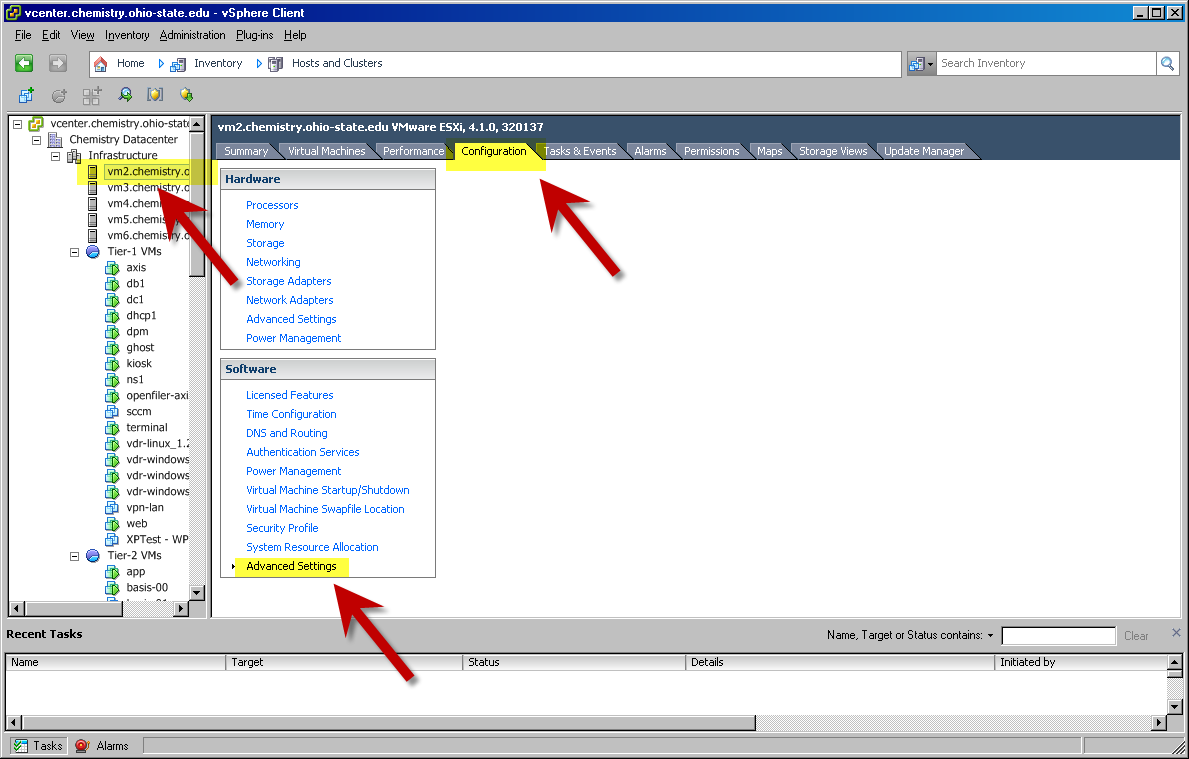
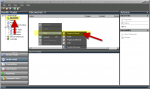
- Open your Hosts and Clusters view in vCenter (if you have it).

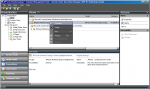
- Select the first host you want to collect from, then click the ‘Configuration’ tab, then ‘Advanced Settings’.

- Click ‘Syslog’ on the left pane, then enter the dns name or IP address of Win-Syslogs in the top box. Make sure you’re using Port 514, because OpsMgr will only listen on this port, then click OK.

Creating the Custom Management Pack
Getting Started
- First, open System Center Authoring Console and click the ‘New Management Pack’ button.

- Then, give your management pack a name.
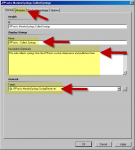
- Next, enter a display name and description, then click Create. The display name will show when looking at the list of management packs in the OpsMgr Console’s Administration view.. The description text is as follows: This management pack contains a custom datasource which processes Syslog events with a PowerShell script, and maps parsed properties to generic OpsMgr events. It also contains a custom rule to collect and publish these events, and a view to look at them.

Creating the Data Source
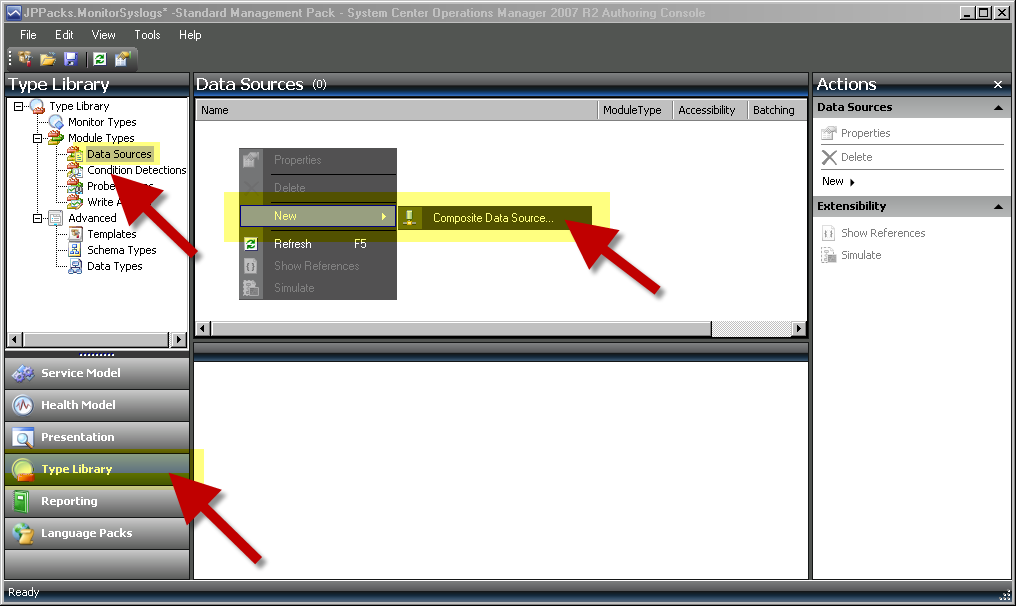
- Next, click the “Type Library” view, then select ‘Module Types’ -> ‘Data Sources’. Right-click and choose “New” -> “Composite Data Source”.

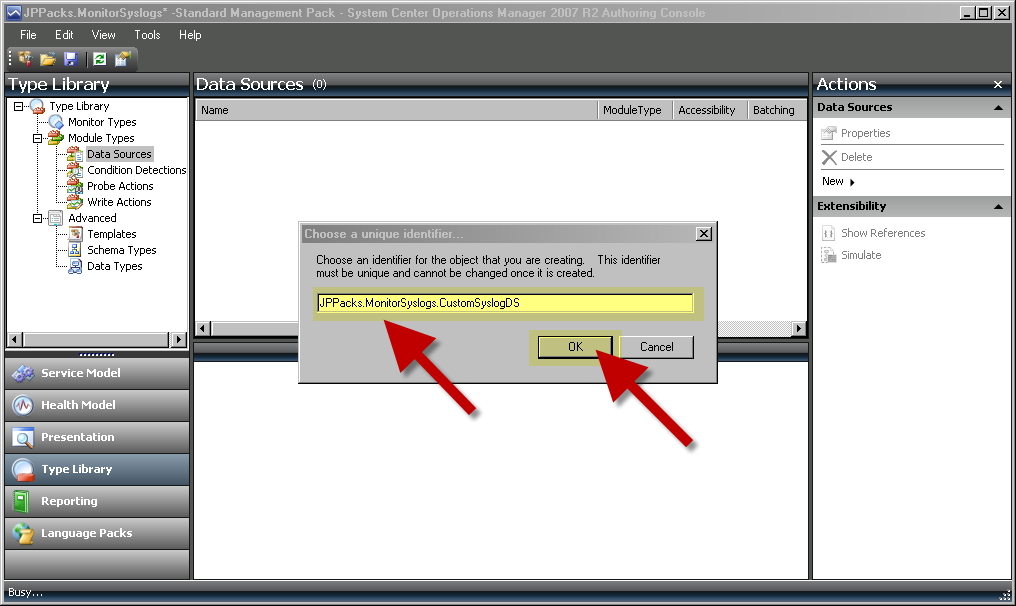
- Name your new Data Source, then click “OK”.
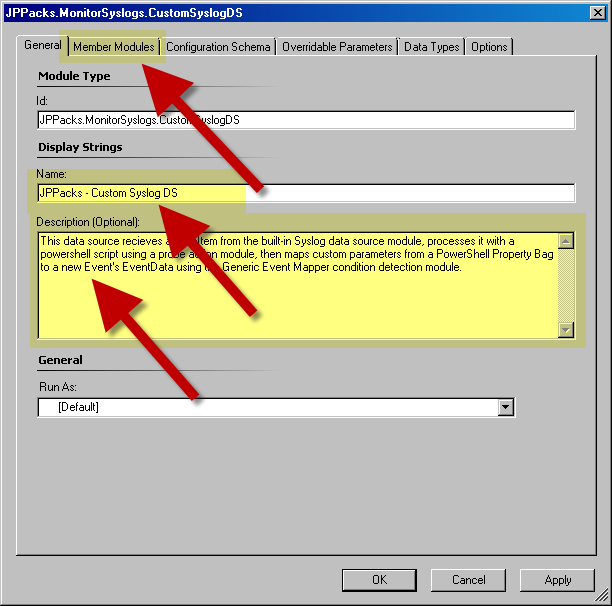
- Enter a name for your composite data source, then a description. When finished, click the “Member Modules” tab. The name will show up when creating a custom view. The description text here is as follows: This data source recieves a DataItem from the built-in Syslog data source module, processes it with a powershell script using a probe action module, then maps custom parameters from a PowerShell Property Bag to a new Event’s EventData using the Generic Event Mapper condition detection module.

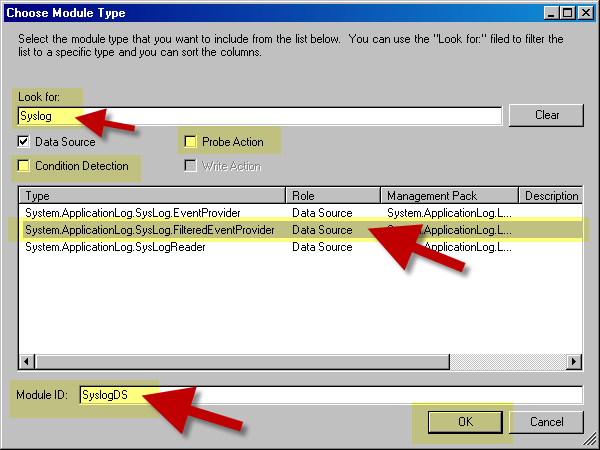
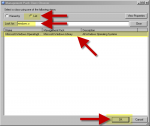
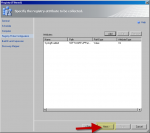
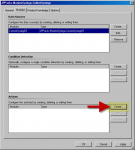
- Click “Add.”
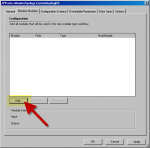
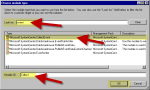
- Un-Check “Condition Detection” and “Probe Action”, then enter “Syslog” in the “Look for:” text box. Select “System.ApplicationLog.Syslog.FilteredEventProvider”, then enter “SyslogDS” as the Module ID, then click OK.

- Click “Configure”.
- For Parameter name enter “Severity”, for Operator choose “Less than or Equal To”, for Value enter “$Config/MinSeverity$”.

- The configuration should now say “Port 514″, and have the information filled in that you just entered. If so, click “OK”.

- Click ‘Add’ again.

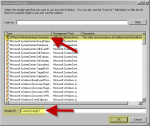
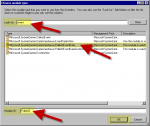
- Un-Check “Condition Detection” and “Data Source”, then enter “Powershell” in the “Look for:” text box. Select “Microsoft.Windows.PowerShellPropertyBagProbe”, then enter “ParseScript” as the Module ID, then click OK.

- On the ParseScript configuration window, enter “Parse-SyslogEvents.ps1″ as the script name, and “30″ as the TimeoutSeconds value. Then, click “Edit”.

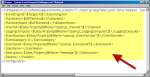
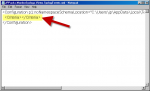
- Familiarize yourself with the default XML structure. You will be adding the script text between <ScriptBody> and </ScriptBody>. You will also be inserting <parameters> tags after </ScriptBody>.
- First, insert the Parameters tags as follows:
<Parameters>
<Parameter>
<Name>xmlText</Name>
<Value>$Data$</Value>
</Parameter>
</Parameters>

- Next, insert the PowerShell parsing script between the ScriptBody tags as follows:

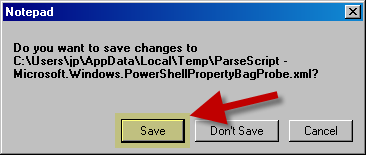
- Save and close the XML file.
- Verify that the settings look correct, then click OK.

- Click, ‘Add’ again.

- Un-Check “Data Source” and “Probe Action”, then enter “Event” in the “Look for:” text box. Select “System.Event.GenericDataMapper”, then enter “Mapper” as the Module ID, then click OK.

- On the “Mapper” configuration page, click “Edit”.

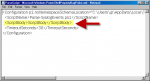
- Familiarize yourself with the XML structure of the Mapper.

- Replace <EventOriginId> through <Params> with the following code:
<EventOriginId>$Target/Id$</EventOriginId>
<PublisherId>$MPElement$</PublisherId>
<PublisherName>$MPElement$</PublisherName>
<Channel>$Data/Property[@Name=”opsmgr_Channel”]$</Channel>
<LoggingComputer>$Data/Property[@Name=”opsmgr_LoggingComputer”]$</LoggingComputer>
<EventNumber>$Data/Property[@Name=”opsmgr_EventNumber”]$</EventNumber>
<EventCategory>0</EventCategory>
<EventLevel>$Data/Property[@Name=”opsmgr_EventLevel”]$</EventLevel>
<UserName></UserName>
<Description>$Data/Property[@Name=”Message”]$</Description>
<Params></Params>
- Close the XML file and click “Save”.
- Verify that the settings look correct, then click “OK”.

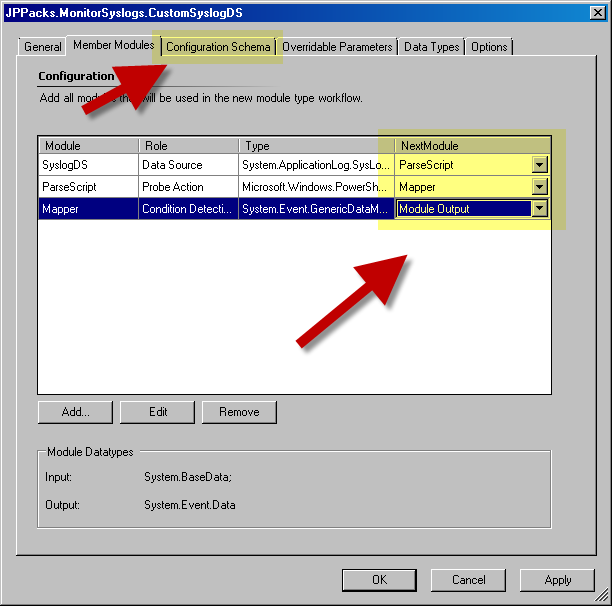
- Configure the “NextModule” fields so that SyslogDS leads to ParseScript leads to Mapper leads to Module Output.

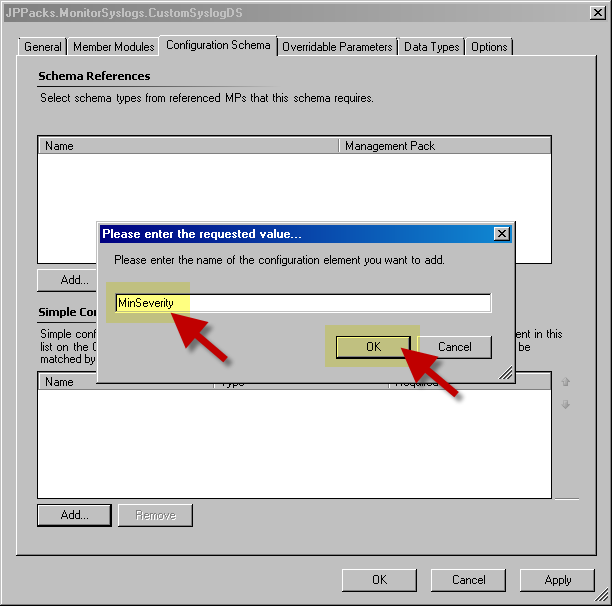
- Click the “Configuration Schema” tab, then in the bottom frame click “Add”.

- Enter “MinSeverity” as the value, then click “OK”.

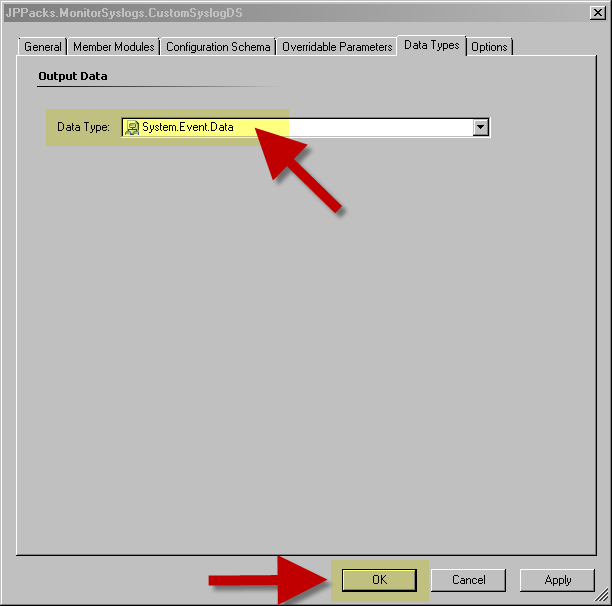
- Change “Type” to “Integer”, then click “Data Types”.

- Under the drop-down box, choose “System.Event.Data”, then click “OK”

Creating the Syslog Receiver Class
- Click “Service Model” to change views.

- Choose “Classes” from the left pane, then Right-Click the right pane and choose “New” -> “Custom Class”.

- Enter an ID for your custom class.
ID: JPPacks.MonitorSyslogs.SyslogReceiver

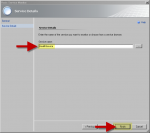
- Enter a name and description for the custom class, then check the “Hosted” box, then Browse for a base class.
Name: Syslog Receiver
Description: Computer that receives syslog data.

- Click the “List” radio button, then choose “Microsoft.Windows.ComputerRole”, and click “OK”.

- Verify that your settings look correct, and click “OK”.

Creating a Discovery for your Class
- Click “Health Model” to change views.

- Click “Discoveries” in the left pane, then right-click the right pane and choose “New” -> “Registry (Filtered)”.
- Enter an ID, Name, and Description for your Discovery. Then, click “…” to browse for a target.
ID: JPPacks.MonitorSyslogs.DiscoverSyslogReceivers
Name: JPPacks – Discover Syslog Receivers
Descriptoion: This discovery looks for the following registry DWORD value: “HKLM\SOFTWARE\JPPacks\SyslogEnabled”. If the value is present and equal to “1″, this discovery rule creates an instance of the ‘Syslog Receiver’ class referencing the discovered computer.

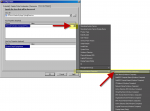
- Click the “list” radio button, then in the “Look for” text box enter “windows.o”. Click to choose “Microsoft.Windows.OperatingSystem”, and click “OK”.
- Verify that your settings look correct, and click “Next”.

- Change the schedule to run once per day. To get things started faster we can create an override inside OpsMgr console once the management pack is imported.

- On the “Computer” screen, keep the defaults and click “OK”.

- On the registry Probe Configuration page, click “Add”, then “Value”, then enter:
Name: “SyslogEnabled”
Path: SOFTWARE\JPPacks\SyslogEnabled
Attribute Type: Int

- Confirm that the settings look correct and click “Next”.
- On the “Build Event Expression” page, click “Insert” then choose:
Parameter Name: “Values/Syslog Enabled”
Operator: “Equals”
Value: 1

- On the “Discovery Mapper” page, under “Key Properties (Required)”, browse for a property then choose “(Host=Windows Computer)” -> “Principal Name”.
- Browse to the same property under “Non Key Properties (Optional)”, then click “Finish”.

- Verify that your settings look correct, than click “OK”.

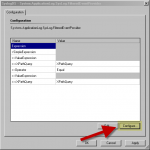
- Right-Click your new discovery, and choose “Properties”.

- Click the “Configuration” tab, then scroll down to the bottom of the window. Make sure that the last 2 @Type names are set to value “Integer”, than click “OK”.
Reference the Data Warehouse Module
- Click “Health Model” to change views.

- Click “File” -> “Management Pack Properties”.

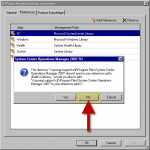
- Click the “References” tab, then click “Add Reference”.

- Browse to the Operations Manager 2007 server directory, and choose “Microsoft.SystemCenter.DataWarehouse.Library.mp”, then click “Open”.

- When asked to add the path to your reference paths, click “No”.
- Confirm that your settings look OK, then click “Close”.

Creating the Event Collection Rule
- First, select “Rules” on the left pane, then right-click the right pane and choose “New” -> “Custom Rule”.

- Give your rule an ID, then click OK. I chose “JPPacks.MonitorSyslogs.CollectSyslogs”.

- Enter a display name and description for your rule, then change the target to the custom class you created in previous steps. When finished click the “Modules” tab. I chose for following values:
Name: “JPPacks – Collect Syslogs”
Description: “This rule collects processed syslog events from the JPPacks custom datasource and publishes them.”
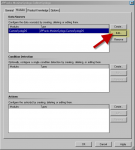
- On the “Modules” tab, under “Data Sources”, click “Create”.

- Choose the Custom Data Source created in previous steps, then name the Module ID “CustomSyslogDS”, then click “OK”. My Data Source has the ID “JPPacks.MonitorSyslogs.CustomSyslogDS”.
- Click “Edit” to configure the CystomSyslogDS module.
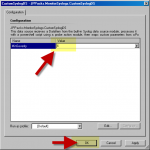
- Under “MinSeverity”, enter the minimum severity of the Syslog that you want to collect then click, “OK”. A value of “4″ will collect all warnings and above (Warnings, Errors, Emergencies, etc.).
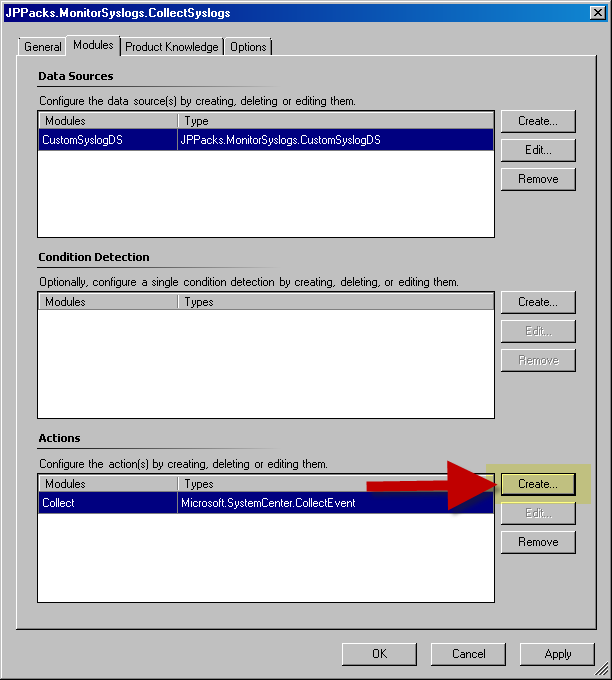
- On the “Modules” tab, under “Actions”, click “Create”.
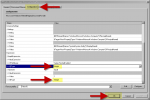
- In the “Look for:” box, enter “event”, then choose “Microsoft.SystemCenter.CollectEvent”. Then, in the “Module ID” box enter “Collect”, then click “OK”.
- On the “Modules” tab, under “Actions”, click “Create” again.

- In the “Look for:” box, enter “event”, then choose “Microsoft.SystemCenter.DataWarehouse.PublishEventData”. Then, in the “Module ID” box enter “Publish”, then click “OK”.
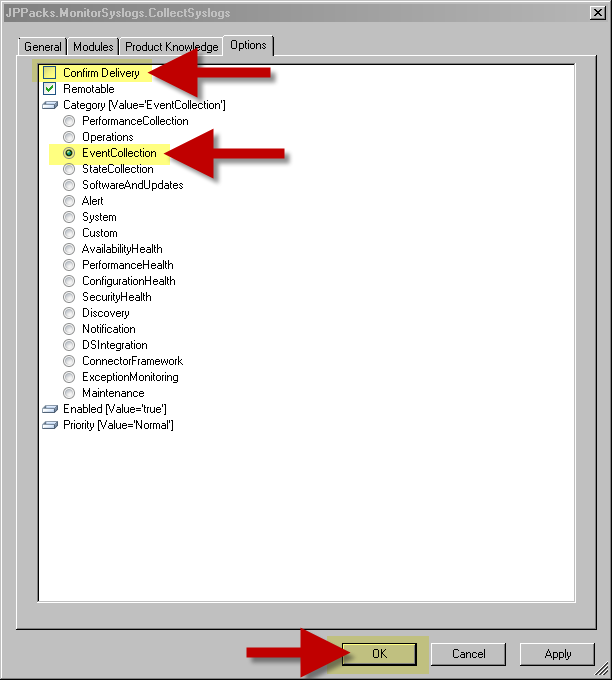
- Confirm that your settings look correct, then click the “Options” tab.

- Uncheck “Confirm Delivery”, and change “Category” to “Event Collection”, then click “OK”.

Creating Views to See Events
- Click “Presentation” to switch views.

- Click “Views” on the left pane, then right-click the right pane and choose “New” -> “Folder”.

- Enter an ID for the view and click “Next”.
ID: JPPacks.MonitorSyslogs.Views.JPPacksViews

- Right-click the right pane again, and choose “New” -> “State View”.

- Enter the following information:
ID: JPPacks.MonitorSyslogs.Views.SyslogReceiversState
Display Name: JPPacks – Syslog Receivers State
Description: This view shows the names and states of all discovered Syslog Receivers.
Target: choose ‘JPPacks.MonitorSyslogs.SyslogReceiver’
Category: Choose ‘AvailabilityHealth’

- Right-click the right pane again, and choose “New” -> “Event View”.
- Enter the following information, then click “Finish”.
ID: JPPacks.MonitorSyslogs.Views.SyslogEvents
Display Name: JPPacks – Syslog Events
Description: This view shows all syslog events received by instances of the ‘Syslog Reveiver’ class.
Target: choose ‘JPPacks.MonitorSyslogs.SyslogReceiver

- Right-click the Event View you created, then choose “Properties”.
- Click the “Configuration” tab, then click “Edit”.

- Familiarize yourself with the XML layout. We will be replacing the criteria tags.
- Replace the <Criteria> tags with the text provided by the file named “JPPacks.MonitorSyslogs.Views.SyslogEvents.txt”. If you followed the Preparation heading, you already have this. Otherwise, download it here: JPPacks.MonitorSyslogs.Views.SyslogEvents.txt.

- Verify that your settings look correct, then click the “Folder” tab.

- Ensure that the only box checked is the folder you want this view to reside in. For me, that’s “JPPacks.MonitorySyslogs.Views.JPPacksViews”, then click “OK”.

- Right-click the State View created in step 4, and choose “Properties”.
- Click the “folder” tab, and ensure that the only box checked is the folder you want this view to reside in. For me, that’s “JPPacks.MonitorySyslogs.Views.JPPacksViews”, then click “OK”.

- Right-click the folder you created in step 2 and choose “Properties”.

- Enter the following information:
Name: JPPacks Views
Description: This folder contains all views related to the JPPacks Management Pack.

Creating a Health Monitor
- Click “Monitors” from the left pane, then expand “System.Health.EntityState”. Right-click “System.Health.AvailabilityState” and click “New” -> “Windows Services” -> “Basic Service Monitor”.

- Enter the following information then click “Next”.
Element ID: JPPacks.MonitorSyslogs.Monitors.AvailabilityState.HealthService
Display Name: JPPacks Monitors – Health Service
Description: This monitor watches the health service on Syslog Receivers and reports its status.
Target: choose JPPacks.MonitorSyslogs.SyslogReceiver
Parent Monitor: choose System.HealthAvailabilityState
Category: AvailabilityHealth

- For “Service Name” enter “HealthService”, then click “Finish”.
- Confirm that your settings look correct.
Congrats! Your management pack is complete! Now, follow the steps under “Short-Cut!” to get it working (except step 2 of course).
As always, check my Chemistry Wiki for semi-organized info on Operations Manager as I continue to learn it.
See Part 2 – Basic Reports to get this data exported.
References:
-
For Severity\Facility levels and a general overview of the basic practice — MicroSoft
-
For a much better overview of the general technique
-
The most detailed walkthrough I’ve found, but for alerts not events.
Nguồn: http://windowsmasher.wordpress.com/2011/02/07/monitoring-esxi-syslogs-with-opsmgr-2007-r2/#CreatingADiscoveryForYourClass